If you’re starting a career in data analysis or looking to enhance your skills, Excel is an indispensable tool to have in your arsenal. Among the many features Excel offers, there are certain functions that every data analyst should master. These functions will help you efficiently manipulate, analyze, and extract insights from data and you will probably end up using them every day.
Table of Contents
ToggleIn this guide, we’ll delve into the 10 essential Excel functions that will empower you to excel in data analysis.
1. SUM()
The SUM() function is your Swiss Army knife for numerical data analysis. Whether you need to calculate the total sales for a month, the sum of test scores, or the revenue from multiple products, SUM() is your go-to function.

The function accepts the following arguments:
- Number1: This is the first numeric value to be added.
- Number2: This is the second numeric value to be added.
The “number1” argument is required while the subsequent numbers (“number 2”, “number 3”, etc.) are optional.
=SUM(A1:A10)Adds the values of all the cells within A1:A10 cell range.
The SUM() function is probably the most used function in Excel and is an essential part of both simple and complex calculations.
2. AVERAGE()
AVERAGE() is your tool for finding the mean of a set of numbers. Understanding central tendencies is crucial in data analysis as it helps you grasp the typical value in your dataset.

=AVERAGE(B5:B9)Calculates the average number of all numbers included in a range B5:B9.
3. MAX() and MIN()
MAX() and MIN() functions help you swiftly identify the highest and lowest values within a dataset. This is essential for finding extreme values in your data and pinpointing outliers or understanding the data range.
=MAX(C1:C100)Finds the MAX value within range.
=MIN(C1:C100)Finds the MIN value within range.
4. COUNT()
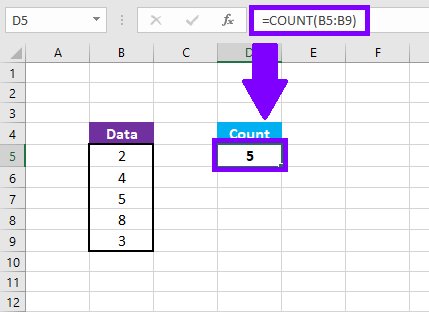
COUNT() allows you to count the number of data points within a given range, which is a fundamental step in understanding the size of your dataset. It is generally used to count the number of cells in Excel or array of numbers.

=COUNT(B5:B9)Counts the number of values within specified cel range.
5. VLOOKUP()
VLOOKUP() is a powerhouse function for mastering data lookup. It enables you to search for a value in a table and retrieve a corresponding value. This is invaluable for merging data from various sources or cross-referencing information.
VLOOKUP stands for Vertical Lookup. As the name specifies, VLOOKUP helps you look for a specified value by searching for it vertically across the sheet. And it is one of the most useful Excel tools you will use.
=VLOOKUP(lookup_value, table_array, col_index_number,[range_lookup])- lookup_value: value that you want to look up in our data.
- table_array: location where the values are.
- col_index_number: the column number from where we need to return the value.
- range_lookup: This has two options; if the value is set to FALSE, that means we are looking for an exact match. If the value is TRUE, then we are looking for an approximate match.
6. IF()
IF() introduces conditional logic into your data analysis. You can set criteria and instruct Excel to perform different actions based on these conditions. This is particularly handy for segmenting data or classifying information.
In addition, you can create multiple conditions with nested IF() functions.
=IF(logical_test, [value_if_true], [value_if_false])- logical_test (required) – the condition to test. Can be evaluated as either TRUE or FALSE.
- value_if_true (optional) – the value to return when the logical test evaluates to TRUE.
- value_if_false (optional) – the value to return when the logical test evaluates to FALSE.
7. CONCATENATE()
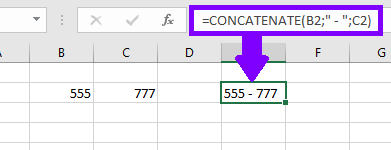
Data analysis often involves working with textual data. And this is where the CONCATENATE() function comes to scene. The CONCATENATE() allows you to merge text from different cells into one. It is useful when creating custom labels, descriptions, or combining first and last names of your clients.

8. DATE()
Excel is exceptional at handling date-related data, and DATE() lets you create date values from individual year, month, and day components. This is essential when working with time series data, which is a common task.
=DATE(year, month, day)You can specify exact year, month and day, or use cell reference within DATE() function.
9. LEN()
LEN() helps you find the length of a text string, which can be crucial when dealing with textual data or addressing character limitations in databases or reports.

10. Pivot Tables
While not a standalone function, pivot tables are an advanced feature within Excel that every data analyst should master. Pivot tables allow you to summarize, analyze, and visualize data from large datasets swiftly. If you’re dealing with complex data structures and want to extract meaningful insights, mastering pivot tables is a game-changer.
How to Create a Pivot Table:
- Select your dataset.
- Go to the “Insert” tab and choose “PivotTable.”
- Set your rows, columns, values, and filters to organize your data as needed.
These 10 essential Excel functions and features provide a robust foundation for your journey into data analysis. As you become more proficient, you’ll discover that Excel offers a plethora of advanced functions, such as INDEX(), MATCH(), and more. Keep in mind that practice is key to mastering these functions and features. The more you use them in real data analysis scenarios, the more comfortable and proficient you’ll become.
So, where should you start? Begin with a small dataset or your own personal data to practice. Create a mock sales report, track personal expenses, or analyze any data that piques your interest. The more you engage with data in Excel, the more you’ll learn and grow.
Lastly, don’t hesitate to ask questions or seek guidance. The data analytics community is filled with experienced professionals and online resources that can help you on your journey. Feel free to leave a comment below if you have any questions or want to delve deeper into a specific function or aspect of data analysis.
Happy data crunching, and remember, the world of data analysis is vast and exciting, with Excel as your trusty companion!


