In Power BI, relationships between tables play a vital role in connecting and analyzing data from multiple sources. By establishing relationships, you can create powerful visualizations and perform cross-table analysis. Here’s a step-by-step guide on implementing relationships between tables in Power BI.
Table of Contents
ToggleRelated Tables
Start by identifying the tables in your data model that have common columns or fields. These tables should contain related information that you want to connect.
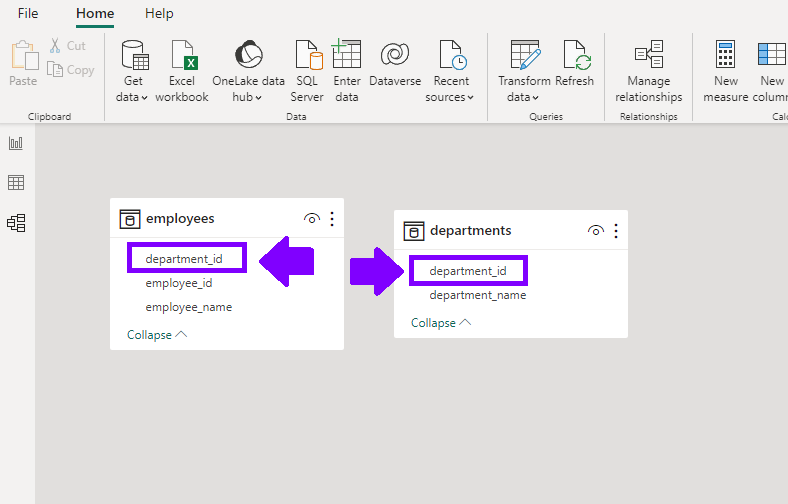
In “employees” table, you could have “department_id” column, which shows the department where each employee works. And you have “departments” table, with data regarding different departments, and also has “department_id” column. Using these two columns, we can connect two tables and create relationship.
Create Relationship
To create relationship, we need to go to go to “Manage Relationships” button in the Modeling tab or navigate to the “Relationships” pane from the View tab. This will open the Relationship view.
Using Manage Relationship
If you click on “Manage Relationship” button, it will open dialog box. Here, we can use Power BI to “autodetect” relationships, or create them ourselves.
To create a relationship, click on “New” button within “Manage Relationships” box.
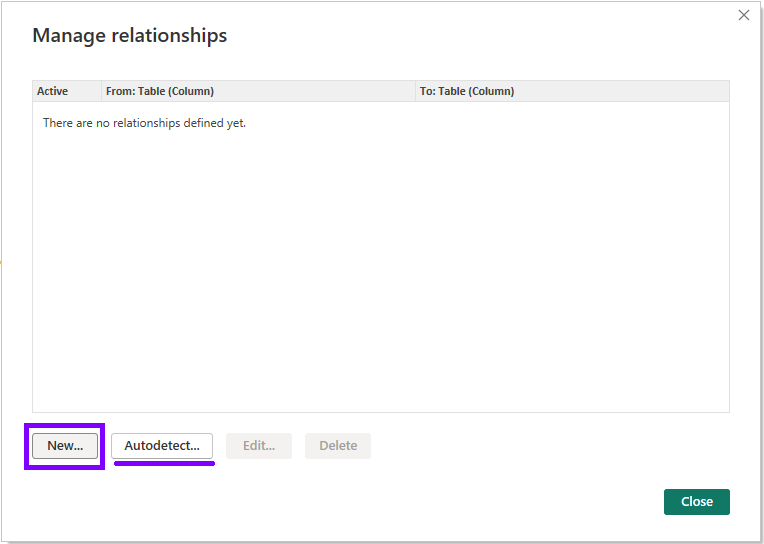
Now just pick tables and columns you wish to create relationship, and click on “New” button. This will create new relationship.

Using Relationship View
To open “Relationship” view, click on “Relationships” pane on the left of canvas. In the Relationship view, you’ll see a diagram representing the tables in your data model.
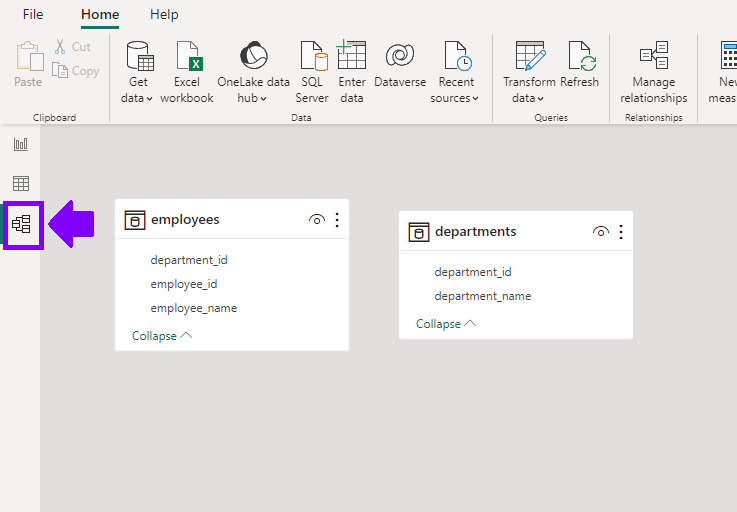
To create a relationship, follow these steps:
- Drag and drop the column from one table to the corresponding column in another table. Power BI will automatically detect the relationship based on matching column names.
- Alternatively, you can right-click on the column in the first table, select “Create Relationship,” and then choose the related column in the second table.
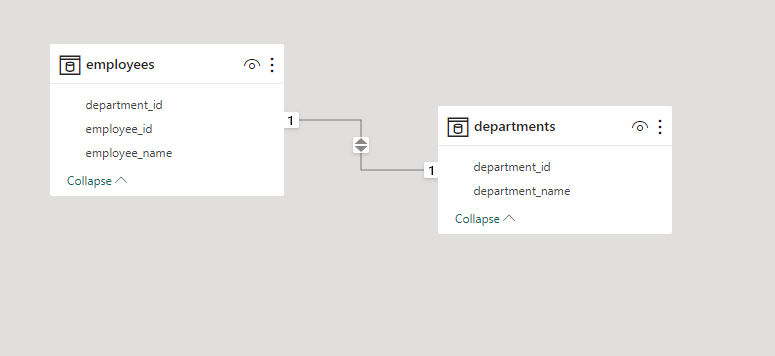
- A line connecting the two tables will appear, indicating that a relationship has been established.
Edit Relationships
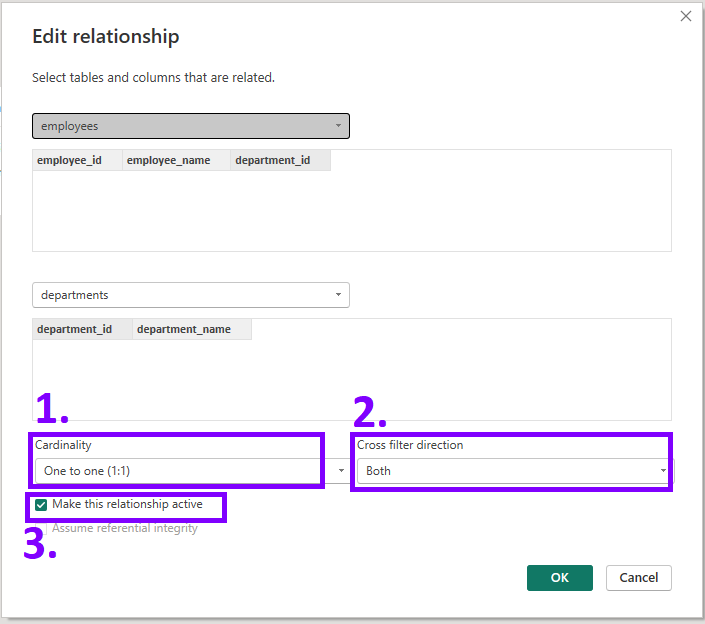
After creating a relationship, you can edit it and configure its properties to optimize data analysis and visualization. Right-click on the relationship line and select “Properties” to access the relationship properties (also, you can just double click on relationship line).
Some key properties to consider are:
- Cardinality: Specify the relationship type between tables, such as “One-to-One,” “One-to-Many,” or “Many-to-Many.” This defines how rows from one table relate to rows in another table.
- Cross-filtering Direction: Determine how filtering in one table affects related tables. Choose between “Both Directions,” “Single,” or “Automatic” based on your analysis requirements.
- Active/Inactive Status: Toggle the relationship on or off. Inactive relationships are not used in calculations or visuals but can be activated later if needed.
Once the relationships are established, you can leverage them in your data analysis and visualizations. Power BI will automatically handle the relationship logic when you create visuals using fields from different tables. You can perform cross-table calculations, slice and dice data, and drill down into related information.

