Calculated columns and measures are essential features in Power BI that allow you to perform data transformations, calculations, and aggregations within your data model. They help enrich your data and enable you to derive valuable insights. Let’s explore how to create calculated columns and measures in Power BI.
Table of Contents
ToggleCalculated Columns
A calculated column is a table extension that is assessed for each row in the table. DAX formulas and values from other columns are used to determine their values.
Insert Column
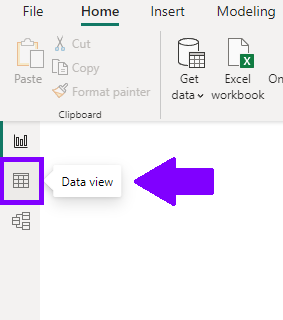
To create calculated columns, first we must go to “Data” view. Select it on the left side of your Power BI canvas.
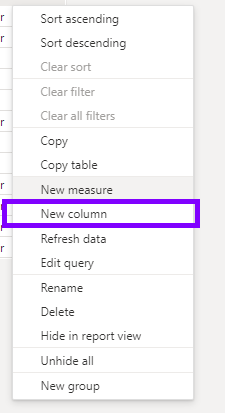
Select the table in which you want to add the calculated column. Right-click on the table name and choose “New Column.”
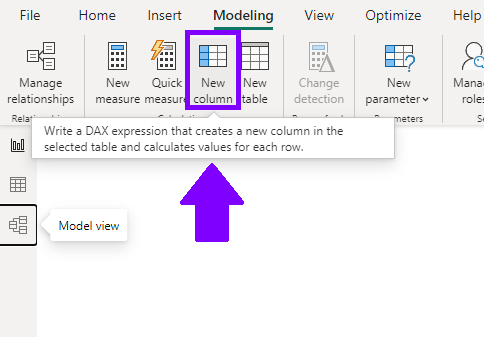
Alternatively, click on the “Modeling” tab in the Power BI Desktop ribbon and select “New Column.”
Write the Calculation
In the formula bar that appears, write the formula for your calculated column using DAX (Data Analysis Expressions) language. DAX is a powerful formula language that enables you to perform calculations based on existing columns or constants.
To create a calculated column that calculates the total sales amount, you can write a formula like:
TotalSales = SUM(Table[SalesAmount]).
After writing the formula, press Enter to create the calculated column. Power BI will compute the calculated values for each row in the table based on the formula you provided.
Measures
Measures, like Calculated Columns, are DAX based calculations. However, a calculated column belongs to a single table, while a measure belongs to the whole data model.
Create Measure
In the “Modeling” tab of the Power BI Desktop ribbon, click on the “New Measure” button.
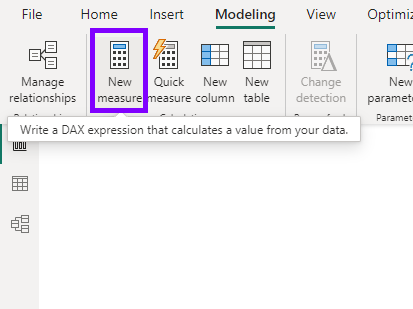
Quick Measures are pre-built measures. You do not have to write your own DAX syntax. You are prompted to input data into dialog boxes, the results are then presented for you to use in your report.
Write the Calculation
In the formula bar, write the DAX formula for your measure. Measures typically perform aggregations or calculations on existing columns or data (SUM, COUNT, AVERAGE, etc).
After writing the formula, press Enter to create the measure. Unlike calculated columns, measures are computed dynamically based on the context of your visualizations and user interactions.
Use Calculated Columns and Measures
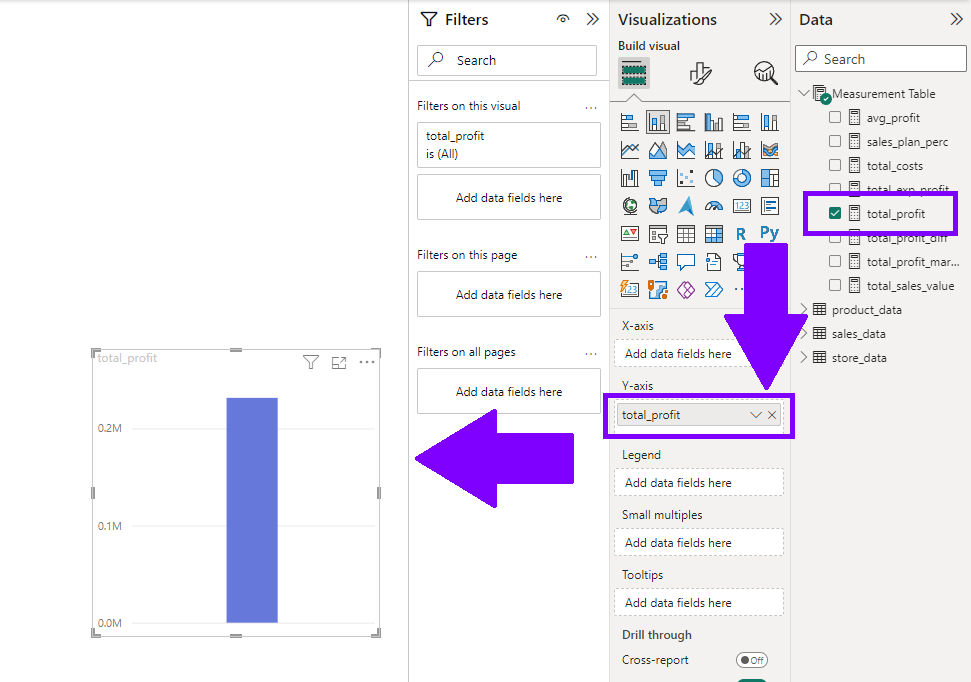
Once you have created calculated columns and measures, you can use them in your visualizations and reports. Drag and drop the calculated columns and measures from the Fields pane onto the visualization canvas to build charts, tables, or other visuals. Power BI will automatically apply the calculations and aggregations defined in the calculated columns and measures to generate insights.
Creating calculated columns and measures, you can extend the capabilities of your data model in Power BI. These features enable you to perform data transformations, complex calculations, and aggregations to derive meaningful insights from your data. Use DAX formulas effectively to create custom calculations that suit your specific analytical needs. With calculated columns and measures, you can build compelling reports and dashboards that help drive data-driven decisions in your organization.

