Slicers and Filters are tools that allow you to empower users to dynamically explore data, gain deeper insights, and extract meaningful conclusions. In this guide, we’ll dive into the world of slicers and filters, equipping you with the knowledge to transform your simple data visualizations into a dynamic and interactive reports.
Table of Contents
ToggleUnderstanding Slicers and Filters
Slicers and filters are interactive elements that enable users to selectively view and analyze data based on specific criteria. These tools empower users to drill into the data that matters most, delivering insights on demand.
Incorporating Slicers
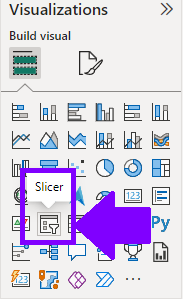
- In Power BI Desktop, head to the “Visualizations” pane.
- Select the “Slicer” visualization type and drag it onto the canvas.
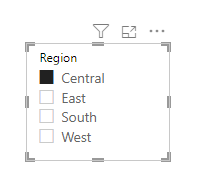
- Choose the field you want to use as a slicer from your dataset, such as “Product Category” or “Region.”
- Users can now interactively select values from the slicer, instantly updating all related visuals.
Implementing Filters
- While designing a visualization, go to the “Visualizations” pane.
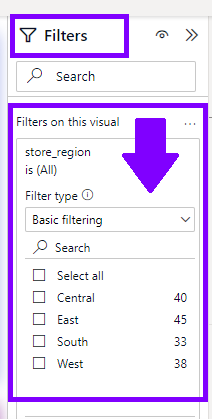
- Locate the “Filters” icon and click on it.
- Choose the field you want to use as a filter, and a filter card will appear in the visualization.
- Users can click on values in the filter card to instantly filter the data displayed in the visualization.
- Apply filters directly to specific visuals or to entire page.
Advanced Slicer Techniques
Taking slicers to the next level enhances the interactivity and engagement of your reports.
Multi-Select Slicers
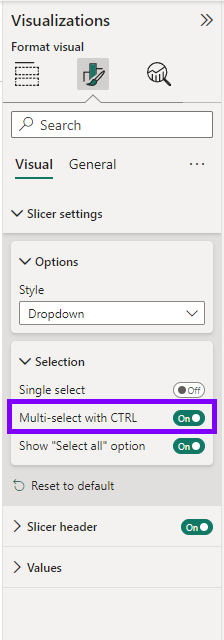
- Enable multi-select on slicers, allowing users to choose multiple values simultaneously.
- In the “Format” section of the slicer, toggle on the “Multi-select with CTRL” option.
Date Slicers
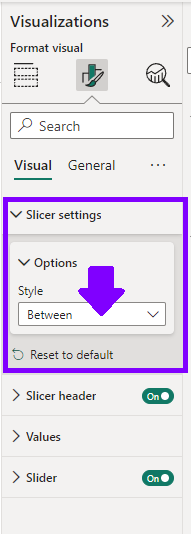
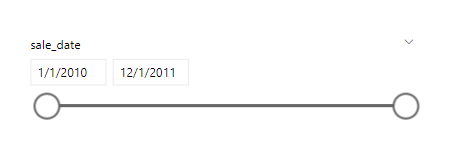
- For date-based data, use the “Date Slicer” visualization type to create a date range picker, like “Between” option.
- Users can easily select a specific date range to analyze data within that timeframe.
By adding Slicers and Filters elements to your Power BI reports, you give users a possibility to reveal insights, patterns, and trends with a few clicks. Slicers bring data subsets to the forefront, while filters allow deep dives into specific areas of interest.

