Power Query Editor in Power BI provides a powerful set of tools for data transformation and manipulation. With its intuitive interface and M language capabilities, you can perform advanced data transformations on your data to prepare it for analysis and reporting. Let’s explore some of the advanced data transformations you can apply using Power Query Editor.
Table of Contents
ToggleEnter Power Query Editor
To access Power Query Editor go to Home tab in Power BI, and select “Transform Data” option:

This will open Power Query Editor, and most of formatting options are located within “Home” and “Transform” tabs.

Splitting and Merging Columns
Splitting and merging columns is useful when you have data in a single column that needs to be separated into multiple columns or vice versa.
Splitting Columns
- Choose a column that contains values you want to separate, such as a full name with first and last names.
- Go to the “Transform” tab, click on “Split Column” and select the splitting option.
- You can split by delimiter (e.g., space, comma), fixed number of characters, or use a custom formula.
Merging Columns
- Select multiple columns you want to merge into a single column.
- Go to the “Transform” tab, click on “Merge Columns” and specify the delimiter to use between merged values.
Conditional Column Creation
Creating conditional columns allows you to add a new column based on specific conditions.
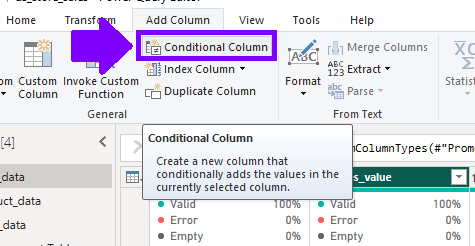
- Go to the “Add Column” tab, click on “Conditional Column.”
- Define the conditions using logical operators (e.g., AND, OR) and specify the output values if the conditions are met.
- The new conditional column will be added to your data based on the specified conditions.

Grouping and Aggregating Data
Grouping and aggregating data help summarize information based on common attributes.
- Select the columns you want to group by.
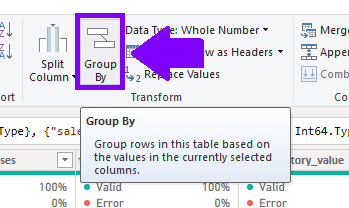
- Go to the “Home” tab, click on “Group By,” and choose the aggregation functions (e.g., sum, average, count) to apply to the grouped data.
- The result will be a new table with the grouped data and calculated aggregate values.

Pivot and Unpivot Columns
Pivoting Data
Pivoting columns reshapes your data by transforming unique values in a column into multiple columns.
- Select the column with unique values you want to pivot.
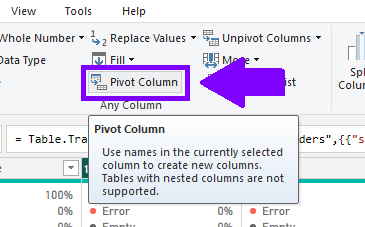
- Go to the “Transform” tab, click on “Pivot Column,” and choose the values column to use as the new column headers.

Unpivoting Data
Unpivoting columns converts multiple columns into two columns, one for attribute names and one for attribute values.
- Select the columns you want to unpivot.
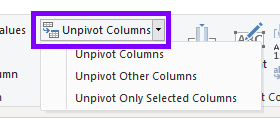
- Go to the “Transform” tab, click on “Unpivot Columns,” and Power Query will transform the data accordingly.

Filling Down and Filling Up Values
Filling down and filling up values are useful for propagating values to fill gaps or missing data.
- To fill down values, select the column, go to the “Transform” tab, and click on “Fill Down.”
- To fill up values, select the column, go to the “Transform” tab, and click on “Fill Up.”

Handling Null and Error Values
Handling null and error values allows you to replace or remove problematic data.
- To replace null values, use the “Replace Values” option in the “Transform” tab to specify replacement values or formulas.
- To remove rows with errors or replace errors with specific values, use the “Remove Errors” option in the “Transform” tab.

These advanced data transformations in Power Query Editor provide you with a comprehensive toolkit to shape and prepare your data for analysis and reporting in Power BI. By leveraging these capabilities, you can create more accurate and insightful reports, and gain deeper insights from your data.

