Power Query Editor is a tool within Power BI that allows users to design and create a robust data model by shaping, transforming, and combining data from various sources. With its intuitive interface and rich set of functionalities, Power Query Editor empowers users to clean, shape, and optimize their data before loading it into Power BI. Let’s dive into a detailed step-by-step guide on how to design and create a data model using Power Query Editor.
Table of Contents
ToggleStart Power Query Editor
To begin designing your data model, launch Power Query Editor in Power BI Desktop. You can access it by clicking on the “Edit Queries” button in the Home tab of the Power BI Desktop ribbon. This will open the Power Query Editor window.
Import Data Sources
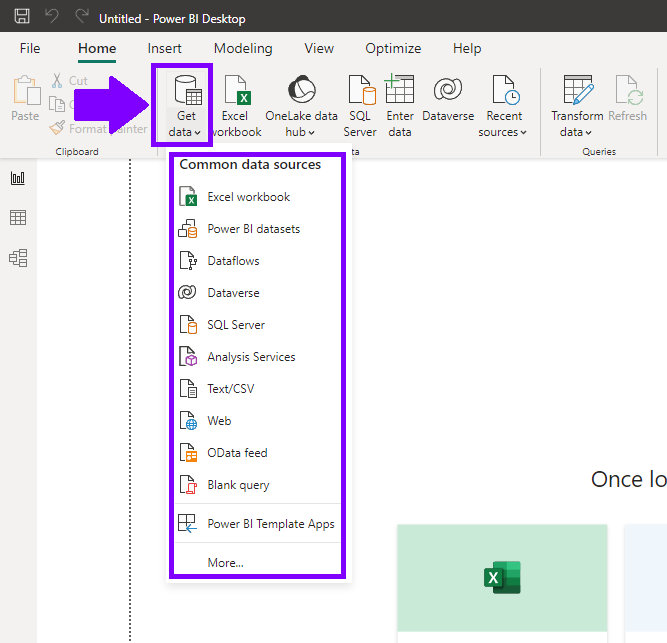
Connect to the data sources you want to include in your data model. Power Query Editor supports a wide range of data sources, including databases, Excel files, CSV files, web services, and more. To import data, click on the “Get Data” button in the Home tab. Select the desired data source and follow the prompts to establish the connection.

Transform and Shape Data
Once the data sources are imported, you can start transforming and shaping the data to meet your requirements. Power Query Editor provides a range of tools and functions for data manipulation. Some common transformations include:
- Filtering: Remove unnecessary rows or filter data based on specific criteria.
- Removing Columns: Eliminate columns that are not required for analysis.
- Changing Data Types: Convert data types to match the desired format.
- Splitting and Merging Columns: Split a column into multiple columns or combine multiple columns into one.
- Renaming Columns: Give meaningful names to columns for clarity.
- Applying Calculations: Add new columns with calculated values based on existing data.
Apply Data Type and Format Changes
To ensure consistency and accuracy in your data model, you can modify data types and formats using Power Query Editor. For example, you can convert text to dates or numbers, format columns for better readability, and standardize data formats across tables.
Create Relationships
To establish relationships between tables in your data model, select the columns that represent the same data across tables. Right-click on the column header, choose “Create Relationship,” and select the related column in the target table. Relationships enable you to perform cross-table analysis and create powerful visualizations based on multiple tables.
Add Calculated Columns and Measures
Power Query Editor allows you to create calculated columns and measures to perform calculations and aggregations on your data. Calculated columns are derived from existing columns using formulas, while measures are calculations based on aggregations such as sums, averages, or counts. You can create calculated columns using Power Query M or other functions, and measures can be defined using the DAX (Data Analysis Expressions) language.
Load Data Model
Once you have designed and shaped your data model using Power Query Editor, it’s time to load it into Power BI Desktop. Click the “Close & Apply” button to load the data model. The data model will be available in the Fields pane, allowing you to explore and analyze the data using Power BI’s visualization capabilities.
Designing and creating a data model using Power Query Editor is a crucial step in building effective and insightful reports and dashboards in Power BI. By following these steps, you can shape and transform your data, establish relationships, and create calculated columns and measures to support powerful data analysis. Power Query Editor’s versatility and user-friendly interface make it a valuable tool for data professionals and business users alike.

