In the realm of data analytics and business intelligence, Power BI has emerged as a game-changing tool that empowers individuals and organizations to visualize and analyze their data in a meaningful and accessible manner. Whether you’re a data enthusiast, business professional, or someone who recognizes the power of data-driven insights, this complete beginner’s guide will serve as your entry point into the exciting world of Power BI.
Table of Contents
ToggleWhy Choose Power BI?
Before we start our Power BI journey, let’s briefly discuss why Power BI stands out among other data analytics tools. Imagine you’re the manager of a growing online store, and your sales data is scattered across various spreadsheets and databases. You want to understand which products are selling like hotcakes, identify your top-spending customers, and assess the impact of your marketing campaigns.
This is where Power BI shines. It’s your data consolidation and visualization wizard. With Power BI, you can seamlessly connect disparate data sources, creating a cohesive story from your scattered data. No more staring at numbers; you’re now in a position to unearth hidden opportunities and make data-driven decisions that propel your business forward.
Getting Started with Power BI
Now, let’s roll up our sleeves and delve into the practical side of using Power BI for data analysis. We’ll break it down step by step, ensuring you gain a firm grasp of its functionality.
Step 1: Download Power BI Desktop
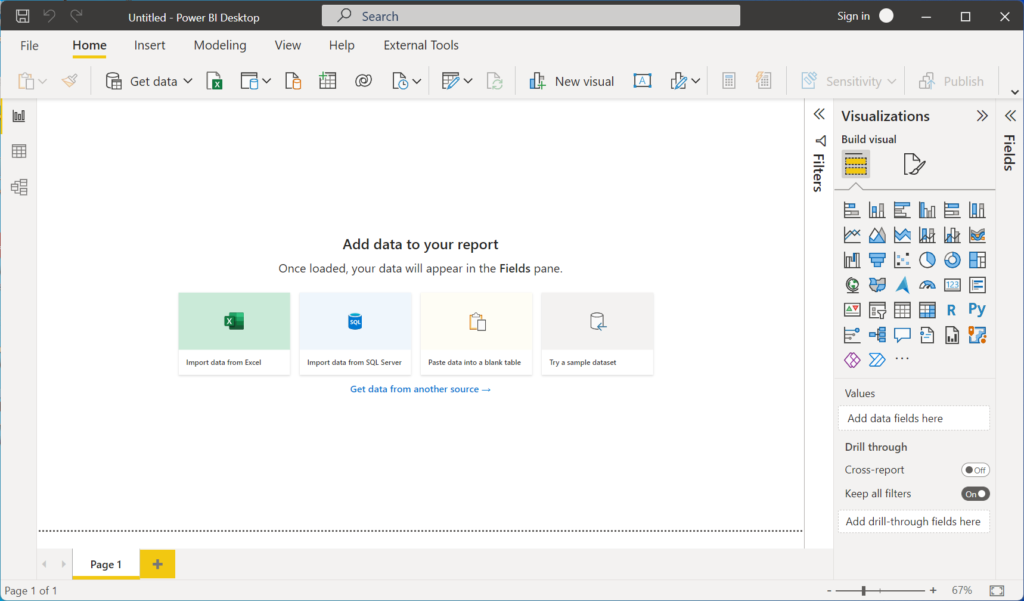
The first and most crucial step is acquiring Power BI Desktop, the tool that’s going to be your data analysis playground. The best part? It’s absolutely free! Head over to the Power BI website, download the software, and follow the installation process. Think of Power BI Desktop as your magic wand, ready to transform raw data into actionable insights.
Step 2: Connecting to Data
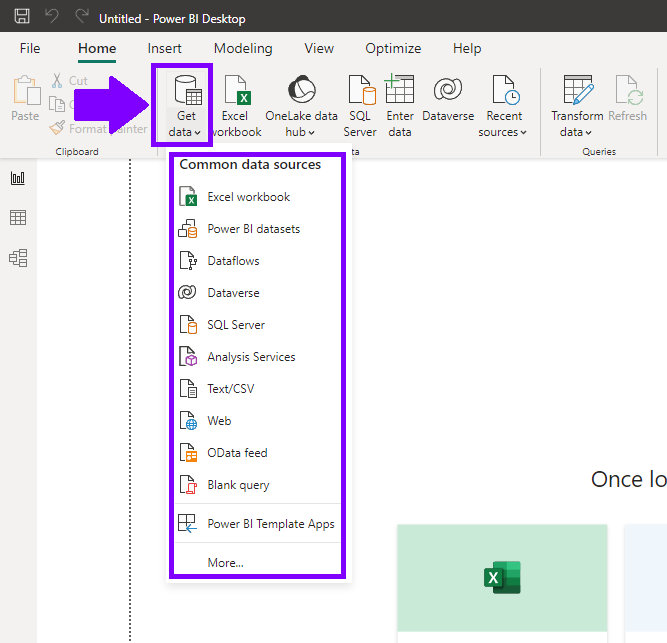
With Power BI Desktop installed, let’s get to the exciting part – connecting to your data. Think of your data sources as scattered puzzle pieces. Power BI is the glue that brings them together, creating a clear picture. You can connect to various data sources, including Excel spreadsheets, databases, or even cloud-based data. Simply click on the “Home” tab, choose your source, and start importing your data.
Step 3: Data Transformation and Shaping
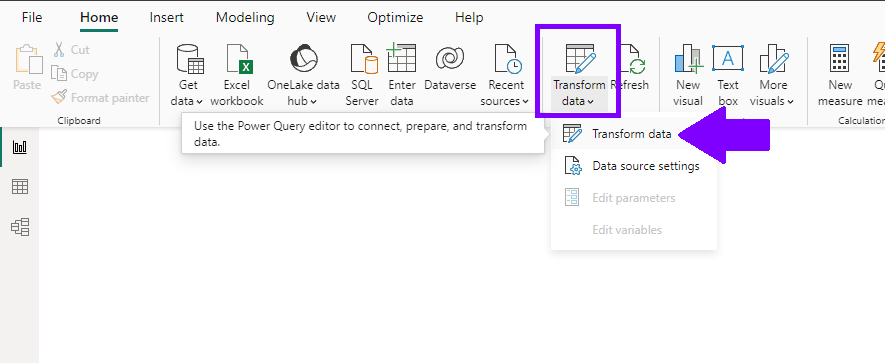
Once your data is inside Power BI, you might need to do a bit of “data cleaning.” Data rarely comes in the perfect format you desire. This is where the Power Query Editor comes to the rescue. It’s like a toolkit for data transformation, allowing you to clean, reshape, and structure your data. You can merge tables, eliminate duplicates, create calculated columns, and more. It’s akin to sculpting clay into a masterpiece.

Step 4: Creating Stunning Visualizations
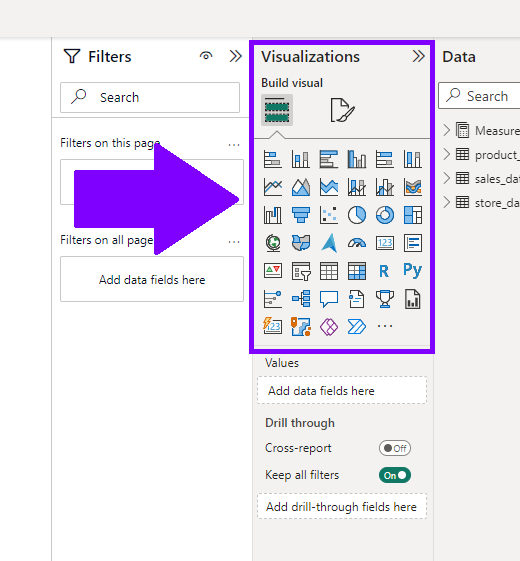
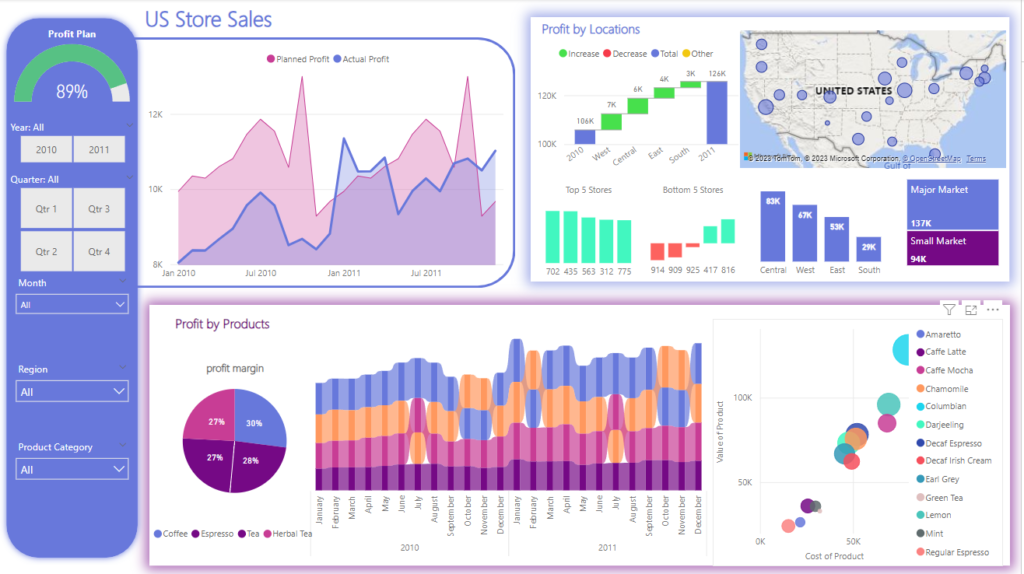
Now, the real fun begins. It’s time to convert those raw numbers into engaging visuals that tell a story. Power BI provides a plethora of visualization options, from basic bar charts and pie graphs to sophisticated maps and tables. The best part is the simplicity – you drag and drop your data fields to create visualizations. But don’t stop there! Customize them to your heart’s content by changing colors, adding labels, and making your data come to life.

Step 5: Building Reports and Dashboards
Reports are the heart of your data analysis journey. They tie everything together and create a structured narrative from your data. In Power BI, you can create reports with multiple pages, each holding a set of visuals that contribute to your data story. Reports are where you tell the whole tale. But if you’re looking for a high-level overview, dashboards are your go-to. They are like executive summaries, showcasing the most critical insights in one place.
Step 6: Sharing Your Insights
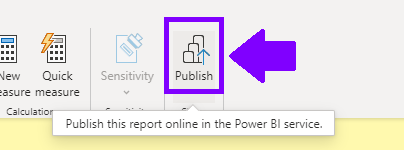
Your data insights are meant to be shared, right? That’s where Power BI’s sharing capabilities come into play. You can publish your reports to the Power BI service, which is a cloud-based platform. From there, you can share your reports with colleagues, clients, or anyone you choose. And the icing on the cake? You can embed your reports into websites or applications, expanding their accessibility.
Practice, Practice, Practice
As the saying goes, practice makes perfect. The more you experiment with Power BI, the more you’ll uncover its hidden gems. Start with a small project or a personal dataset. Analyze your personal expenses, track your fitness progress, or visualize your recipe collection. The more you work with real data, the more proficient you’ll become.
Remember, the Power BI community is your support system. You’ll find an abundance of online tutorials, forums, and endless resources to guide you along the way. If you encounter a challenge or have a question, chances are someone else has been there too.
So, what are you waiting for? Your journey with Power BI starts now. You’ve got the tool, you’ve got the data, and you’ve got the enthusiasm. It’s time to dive in and turn your numbers into meaningful insights. Happy exploring, and enjoy your newfound power in the world of data analysis!


