Conditional logic is your key to unlocking dynamic data transformations and visualization in Power BI. This guide walks you through the process of implementing conditional logic to tailor your data analysis and presentation.
Go to the “Home” tab and click “Transform Data” to enter Power Query Editor. Inside Power Query Editor, you will have an option to to add new columns, which will have conditional logic:
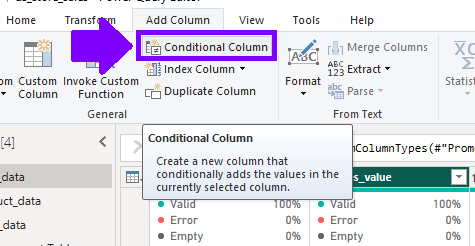
In Power Query Editor, select “Add Column” from the “Modeling” tab.
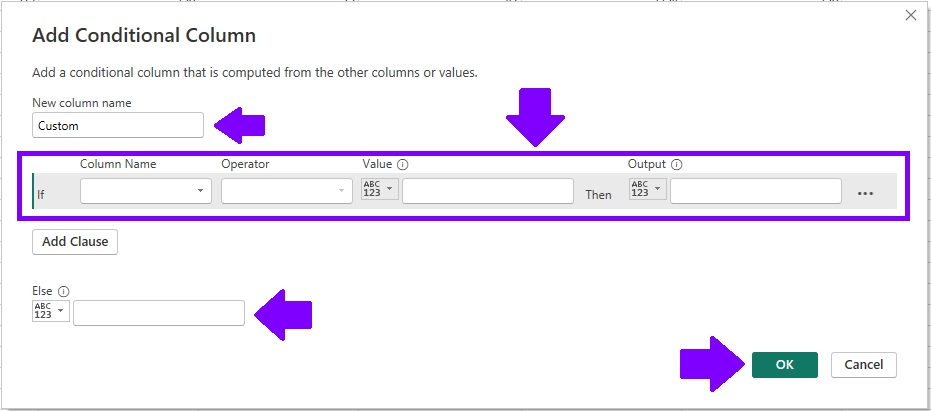
Choose “Conditional Column” and define a new column’s name.
Set your condition using logical expressions.
Specify the values for when the condition is met and not met.
Hit “OK” to create your new conditional column.
Applying Conditional Formatting on Visuals
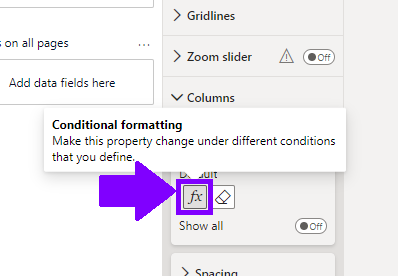
In Power BI’s report view, select the visual you want to format.
Open the “Format” pane on the right-hand side.
Find “Conditional formatting” and turn it on (most commonly within “Columns” section).
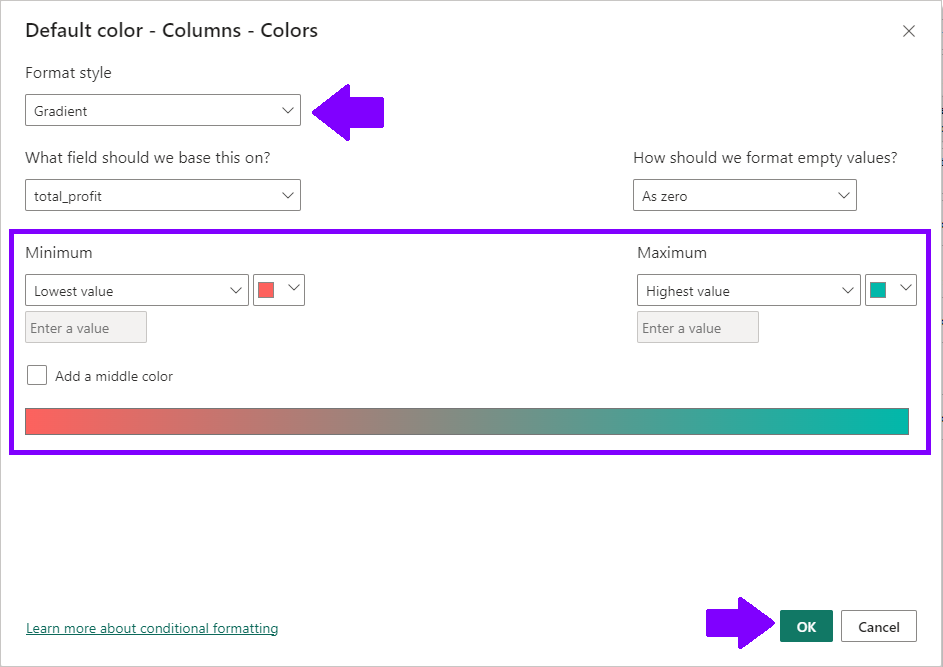
Define your condition and format options.
Watch as your visual dynamically adjusts based on data conditions.
Utilizing DAX Functions for Advanced Logic
In your Power BI report, select “New Measure” from the “Modeling” tab.
Craft your DAX formula using IF, SWITCH, or other functions.
The formula should evaluate conditions and return specific outcomes.
Add this measure to your visuals to display dynamic insights.
By implementing conditional logic, you’ve transformed your Power BI reports into dynamic, intelligent tools. Tailor your data presentation, formatting, and analysis to specific conditions. This customization not only enhances your reports’ visual appeal but also ensures your insights are relevant and impactful.