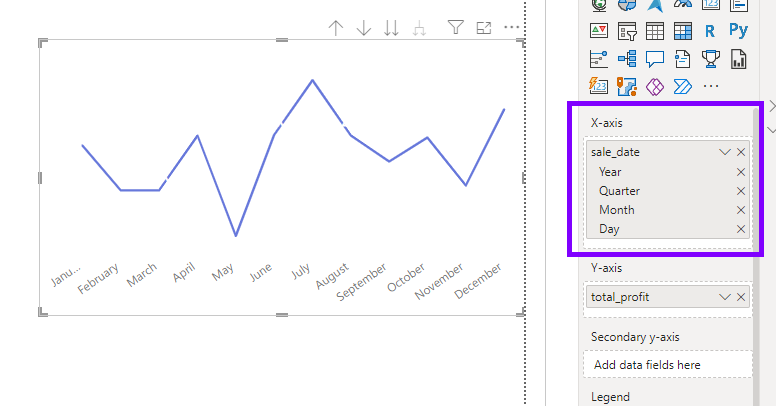
In the world of data analysis, going beyond surface-level insights is key to uncovering the true story behind the numbers. Power BI offers robust features for implementing hierarchies and drill-down functionality, allowing you to dig deeper into your data and reveal valuable insights that might otherwise go unnoticed. In this guide, we’ll explore creating hierarchies and enabling drill-down capabilities in Power BI.
Table of Contents
ToggleUnderstanding Hierarchies
Hierarchies provide a structured way to organize and analyze data across different levels of granularity. By creating hierarchies, you can navigate from a broad overview to more detailed information with just a few clicks, revealing patterns and trends that might otherwise remain hidden.
Choose Hierarchy Levels
Identify the fields in your dataset that naturally lend themselves to a hierarchical structure. Most commonly these are dates. For example, in a sales dataset, you might have “Year,” “Quarter,” “Month,” and “Day.”
Create Hierarchies
- In Power BI Desktop, go to the “Model” view.
- Select the table containing your hierarchy fields.
- Right-click on one of the fields and choose “New Hierarchy.”
- Rename the hierarchy to reflect the levels, e.g., “Date Hierarchy.”
Arrange Hierarchy Levels
Drag and drop the fields into the hierarchy in the desired order, from the most general level (e.g., “Year”) to the most specific (e.g., “Day”)

Enabling Drill-Down Functionality
Drill-down functionality allows users to explore data at different levels of granularity. This interactive feature is especially useful when you want to investigate data patterns and outliers at a more detailed level.
Enable Drill-Down
- Create a visualization (e.g., a bar chart) that includes the hierarchy field from your dataset.
- In “Visualizations” pane, click on the visual you created.
- Go to “Format” and expand the “Drill” section.
- Toggle the “Drill down” switch to “On.”
Use Drill-Down
- When viewing the report, users can click on a data point in the visual.
- Power BI will automatically drill down to the next level of the hierarchy, revealing more detailed information.
Combining Hierarchies and Drill-Down
By combining hierarchies and drill-down functionality, you create a powerful exploration tool that allows users to move seamlessly between different levels of data detail.
- Create a report page with visuals that use the hierarchy fields.
- Arrange visuals in a way that allows users to see the hierarchy structure.
- Set up drill-through actions on visuals that use hierarchy fields.
- Users can click on a data point to drill down and see more detailed information on another visual.
Hierarchies and drill-down functionality in Power BI transform static data into dynamic narratives. By implementing hierarchies, you offer users a guided journey through data layers, enabling quick shifts from macro to micro perspectives.

