In the ever-evolving landscape of data analysis, productivity is not just a desirable trait; it’s a critical factor that can determine the success and efficiency of your analytical endeavors. Time is a precious commodity in the world of data analysis. Projects often come with tight deadlines, and the ability to swiftly navigate through vast datasets, clean and manipulate data efficiently, and derive meaningful insights in a timely manner can make all the difference.
Table of Contents
Toggle
In this blog post, we will explore a variety of Excel tips and tricks that can significantly enhance your productivity, whether you’re just starting your journey in data analysis or looking to refine your skills.
Keyboard Shortcuts for Quick Navigation
Efficiency in data analysis often boils down to how swiftly you can navigate through your spreadsheet. Knowing keyboard shortcuts can make a substantial difference in your workflow. Let’s delve deeper into some essential Excel keyboard shortcuts that can significantly boost your productivity.
- Ctrl + Arrow Keys: Quickly navigate to the edge of your data set. For example,
Ctrl + Right Arrowtakes you to the last filled cell in the row, andCtrl + Down Arrowtakes you to the last filled cell in the column. - Ctrl + Home: Instantly return to cell A1, irrespective of your current location in the spreadsheet.
- Shift + Arrow Keys: Select cells in a specific direction. Combine with
Ctrlto extend the selection by entire blocks. - Ctrl + Space: Select the entire column of the active cell.
- Shift + Space: Select the entire row of the active cell.
- F2: Edit the active cell. Useful for quickly jumping into cell content without using the mouse.
- Ctrl + X, Ctrl + C, Ctrl + V: Cut, copy, and paste, respectively. These shortcuts work seamlessly within Excel, making it easy to move and duplicate data.
- Ctrl + Z, Ctrl + Y: Undo and redo actions. Essential for quickly correcting mistakes or experimenting with changes.
- Ctrl + B, Ctrl + I, Ctrl + U: Apply bold, italic, and underline formatting to the selected text.
- Ctrl + 1: Open the Format Cells dialog box, allowing you to quickly adjust cell formatting options.
- Ctrl + Page Up, Ctrl + Page Down: Move between sheets in a workbook.
- Ctrl + Shift + “+”: Insert a new worksheet.
Flash Fill for Data Cleaning
Flash Fill is a transformative feature in Excel that automates the process of data cleaning, making it more intuitive and efficient. Introduced in Excel 2013, Flash Fill uses pattern recognition to extrapolate and apply a transformation to data based on user-provided examples. This means that instead of relying on complex formulas or manual interventions, analysts can guide Excel in understanding the desired transformation through a few simple examples.
How Flash Fill Works?
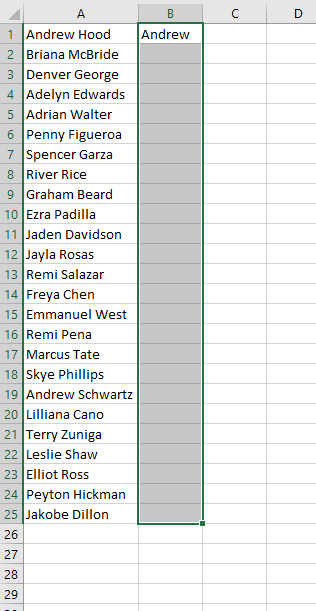
Imagine you have a column of data containing names in the format “First Last” and you want to split them into separate columns for first and last names.
1. In an adjacent column, type the first name for the first entry.
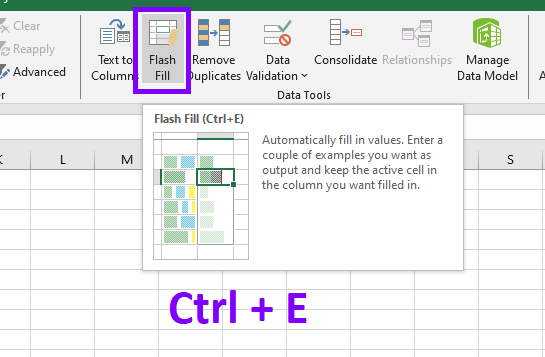
2. Activate Flash Fill: Press Ctrl + E (or go to the Data tab and click on Flash Fill).
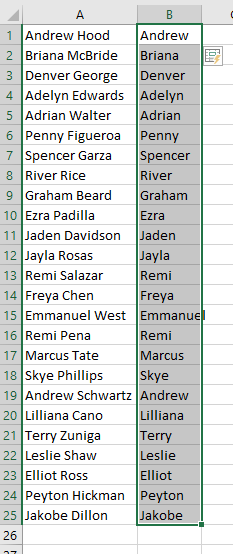
3. Excel uses the example you provided to automatically fill in the first names for the entire column.
PivotTables for Dynamic Summarization
PivotTables are an essential tool for summarizing and analyzing large datasets. They allow you to transform rows of data into a meaningful summary, providing insights with a few clicks. Consider a sales dataset with information on products, regions, and sales amounts. Creating a PivotTable can swiftly summarize total sales by product or region, giving you a clear overview of the data.
Conditional Formatting for Data Visualization
Excel’s conditional formatting is a powerful feature that enables you to highlight specific data points based on predefined rules. This can be instrumental in visually identifying trends, outliers, or patterns within your dataset. For instance, you can use conditional formatting to highlight cells with values above a certain threshold in a different color, making it easier to pinpoint critical information.
Data Validation for Error Prevention
Data quality is paramount in data analysis. Excel’s data validation feature helps prevent errors by restricting the type of data that can be entered into a cell. For instance, you can set up a drop-down list of valid entries for a particular column, ensuring that only accurate and consistent data is inputted.
By incorporating these tips and tricks into your workflow, whether you’re a novice or an experienced professional, you can unlock the full potential of Excel for data analysis. Remember, mastering these tools takes practice, so don’t hesitate to experiment and explore new functionalities to further refine your skills.