Power BI as a business intelligence tool consists of two main components: Power BI Desktop and Power BI Service. Let’s explore each component and understand their interface and key elements
Table of Contents
TogglePower BI Desktop
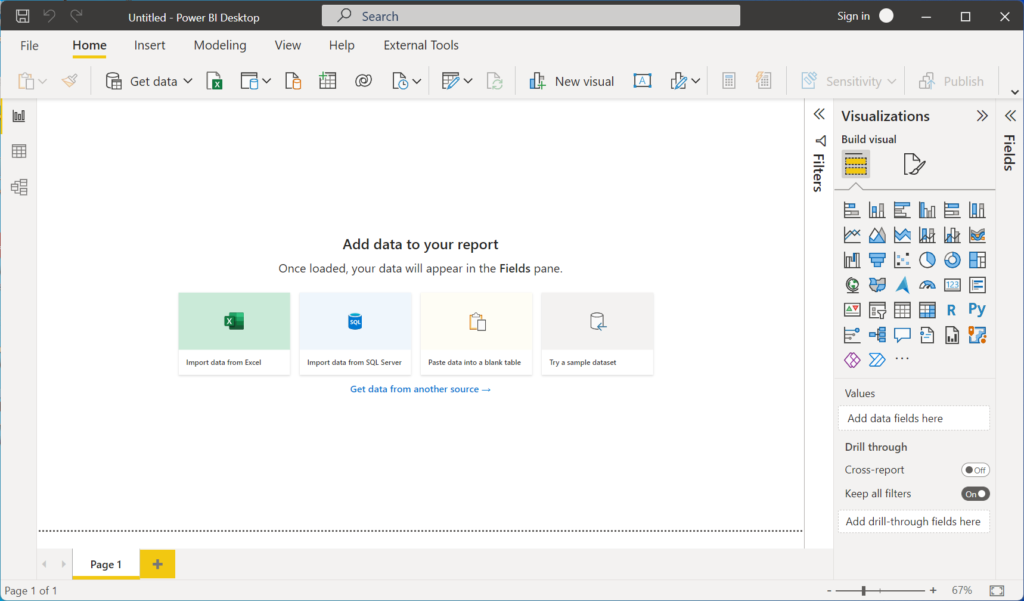
Power BI Desktop is a Windows application that allows users to create interactive reports and dashboards using data from various sources. It provides a rich set of features and capabilities for data modeling, transformation, visualization, and report creation.
Key Elements of Power BI Desktop are:
- Ribbon: The ribbon at the top of the Power BI Desktop window contains tabs such as Home, Modeling, and View. Each tab groups related functionalities and options.
- Canvas: The central area where users design their reports and dashboards by adding visualizations, tables, and other elements.
- Fields pane: Located on the right side of the window, the Fields pane displays the data fields from the imported datasets. Users can drag and drop fields onto the canvas to create visualizations.
- Visualizations pane: This pane provides a wide range of visualization options, such as charts, tables, maps, and more. Users can select a visualization type and customize its properties using this pane.

Power BI Service
Power BI Service is a cloud-based platform that allows users to publish, share, and collaborate on Power BI reports and dashboards. It provides browser-based access to reports, allowing users to view and interact with data from anywhere.
Key Elements of Power BI Service are:
- Workspace: A workspace is a container for reports, dashboards, and datasets. It provides a collaborative environment for team members to work together on shared content.
- Dashboards: Dashboards are visual representations of key metrics and data insights. Users can pin visualizations from reports to dashboards for a consolidated view.
- Reports: Reports in Power BI Service are interactive and dynamic. Users can explore and analyze the data using the visualizations and apply filters and slicers for deeper insights.
- Sharing and Collaboration: Power BI Service enables users to share reports and dashboards with colleagues or stakeholders. Users can control access levels, share content via email, and collaborate on shared reports through comments and annotations.
- Power BI Mobile: Power BI Service seamlessly integrates with Power BI Mobile applications, allowing users to access reports and dashboards on mobile devices.
Power BI Desktop and Power BI Service work together to provide a complete end-to-end solution for data analysis and reporting. Power BI Desktop is used for report creation and advanced data modeling, while Power BI Service offers cloud-based collaboration, sharing, and access to reports and dashboards. The unified interface and consistent experience across both components make it easy for users to develop, publish, and share their data insights.

