In today’s data-driven world, businesses are awash in a sea of information. However, turning this raw data into actionable insights requires a powerful tool like Power BI and its cornerstone, Data Analysis Expressions (DAX). DAX, a formula language, empowers you to extract hidden gems from your data, enabling you to make informed decisions that drive business success.
Table of Contents
Toggle
Why DAX Matters: Unlocking the Power of Power BI
Imagine DAX as the translator between your business questions and the data that holds the answers. It’s a language that allows you to communicate with your data, asking specific questions and eliciting precise responses. DAX formulas, composed of functions, operators, and values, act as the instructions for extracting the knowledge you seek.
DAX is not just another technical term; it’s the key to unlocking the true potential of Power BI. Without DAX, you’re confined to basic visualizations and straightforward calculations. But with DAX, you become a data analysis extraordinaire, capable of:
- Calculations and Measures: DAX empowers you to create custom calculations and measures that align with your specific business needs, going beyond predefined measures.
- Data Aggregation Across Tables: DAX seamlessly combines data from multiple tables, providing a comprehensive view of your data landscape.
- Insights Through Filtering: DAX allows you to focus on specific subsets of data, uncovering hidden patterns and trends that might otherwise go unnoticed.
- Time-Series Analysis with Date and Time Manipulation: DAX enables you to analyze data over time, identifying seasonal trends, long-term patterns, and potential forecasting opportunities.
How DAX Works?
DAX works by evaluating expressions within a specific context. The context is typically a single row or table in the data model. When you write a DAX formula, you are essentially writing a set of instructions that tell Power BI how to calculate a value based on the data in the current context.
DAX expressions are made up of functions, operators, and values. Functions are pre-written formulas that perform common calculations, such as SUM, AVERAGE, and MAX. Operators are symbols that perform mathematical operations, comparisons, and other logical operations. Values are numbers, text, dates, or other data types.
Creating Measures with DAX
Measures are custom calculations that you create to analyze specific aspects of your data. They are typically used to summarize data and perform calculations that are not included in the default measures provided by Power BI.
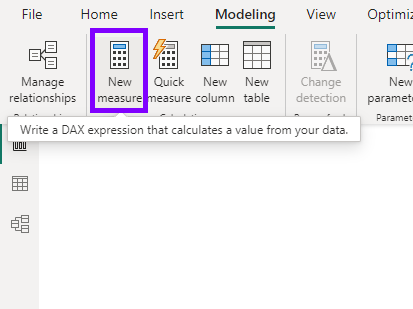
To create a measure in Power BI, follow these steps:
- Click the New Measure button in the Measures pane.
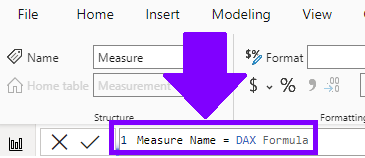
- Enter a name for your measure in the Measure Name box.
- Enter the DAX formula for your measure in the Formula box.
- Click OK to save your measure.
Writing DAX Formulas
DAX formulas are written using a specific syntax that follows a few basic rules:
- Formulas start with an equal sign (=).
- Functions are surrounded by parentheses and include their arguments, separated by commas.
- Operators are used to combine values, functions, and operators.
- Values can be numbers, text, dates, or other data types.
Common DAX Functions
Here are some of the most common DAX functions:
- SUM: Calculates the sum of values.
- AVERAGE: Calculates the average of values.
- COUNT: Counts the number of occurrences.
- MIN: Finds the minimum value.
- MAX: Finds the maximum value.
- FILTER: Filters a table based on a condition.
- RELATED: Returns a related value from another table.
DAX in Action: Practical Examples
Total Sales = SUM('Sales'[Sales Amount])Calculates the total sales by summing up the ‘Sales Amount’ column in the ‘Sales’ table.
Average Order Value = AVERAGE('Orders'[Order Amount])Calculates the average order value by averaging the ‘Order Amount’ column in the ‘Orders’ table.
Customer Count by Country = COUNTROWS(FILTER('Customers', 'Customers'[Country] = "US"))Counts the number of customers located in the United States by filtering the ‘Customers’ table based on the ‘Country’ column and counting the rows.
Maximum Sales Year = MAX('Sales'[Year])Finds the year with the highest sales by finding the maximum value in the ‘Year’ column of the ‘Sales’ table.
DAX might seem daunting at first, but with dedication and practice, you’ll soon be mastering this powerful language and unlocking the true potential of your data. Embrace DAX, and transform yourself into a data-driven decision-maker, capable of extracting insights that drive success. Remember, DAX is not just a tool; it’s a gateway to unlocking the hidden gems within your data, leading you to informed decisions and business growth.