Effective data analysis relies on the ability to organize and present information logically. Power BI equips you with powerful tools like hierarchies and custom sorting to achieve just that. This detailed guide walks you through each step, ensuring you can harness the full potential of these features to create well-structured and visually appealing data narratives.
Table of Contents
ToggleHierarchies
A Power BI hierarchy is a group of linked fields within a dataset that are structured so that one element has higher rank over the other elements. End-users may quickly get an overview and a better grasp of the data through using hierarchies, which make it easy to drill down into the data.
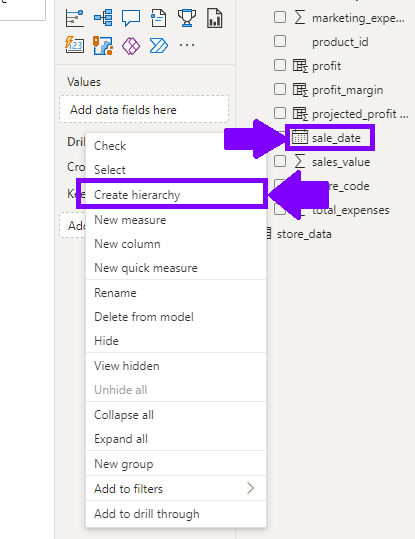
- In Power BI Desktop, choose a column suitable for hierarchies, like “Date” or “Product Category.”
- Right-click on the column, select “New Hierarchy.”
- In the Hierarchy dialog box, arrange levels in the desired sequence.

- Drag the created hierarchy into the “Fields” pane of your visualization.
- Users can now expand or collapse hierarchy levels for a structured view.
Custom Sorting
In Power BI, sorting data is a crucial component in producing successful dashboards and reports. Data is sorted in ascending or descending order by the specified column by default in Power BI. But occasionally you might choose to arrange your data in a way that makes more sense for your particular requirements.
- Head to the Data View.
- Choose the column you want to apply custom sorting to.
- Select “Sort by Column” from the column header dropdown.
- Choose a reference column to establish the sorting order.

Hierarchies and custom sorting are your allies in creating more informative and user-friendly dashboards and reports. Hierarchies simplify exploration, and custom sorting ensures key data stands out.

