Power BI offers a variety of interactive features that allow users to explore and analyze data in a dynamic and intuitive way. These interactive features enable users to delve deeper into the data, gain insights from different perspectives, and make informed decisions.
Table of Contents
ToggleDrill-Through
Drill-Through in Power BI is an interactive feature that allows users to focus on specific details within a visualization by navigating to a new report page with more granular information. It enables users to perform a detailed analysis without cluttering the main report and is particularly useful when users want to investigate specific data points or explore related data in more depth.
How to set up Drill-Through
- Create a new report page that will display the more detailed data when users perform the drill-through action. To do this, go to the “View” tab in the Power BI Desktop, and click on the “New Page” button to add a blank page.
- On the new report page, design the visualization(s) that will show the detailed data. Add charts, tables, or any other visuals that provide the necessary insights when users drill through from the main report page.
- Right-click on the data point or visualization element that you want users to use for the drill-through.
- After right-clicking, a context menu will appear. Choose “Drill Through” from the menu to open the Drill-Through options dialog box. In this dialog box, you can specify the destination report page that users will navigate to when performing the drill-through action.
- Once you have set up the Drill-Through, users can interact with the main report page. When they click on the designated data point or visualization element, Power BI will navigate them to the specified drill-through page, showing more detailed information related to the selected data.
Drill-Down
Drill-Down enables users to explore data hierarchy by breaking down aggregated data into finer levels of detail. It allows users to zoom in on specific dimensions or time periods, revealing more information and facilitating better insights.
How to enable Drill-Down
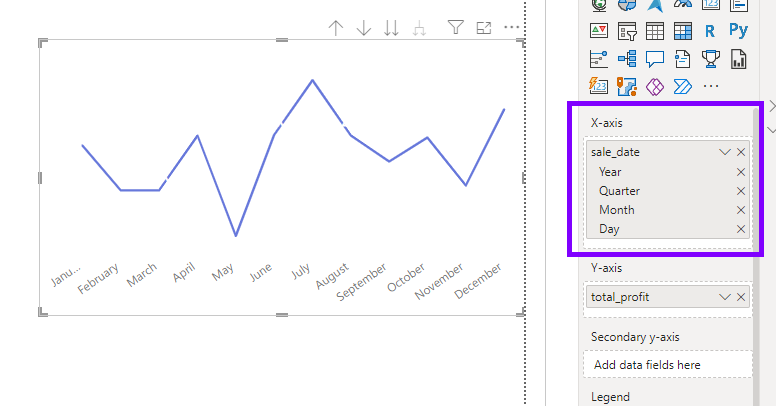
- Create a hierarchical data structure: Make sure your data is organized hierarchically. For example, you can have a “Year” dimension containing “Quarter,” “Month,” and “Day” levels.
- Add hierarchy to the visualization: Drag and drop the hierarchy field into the “Axis” or “Legend” field well of your visualization.
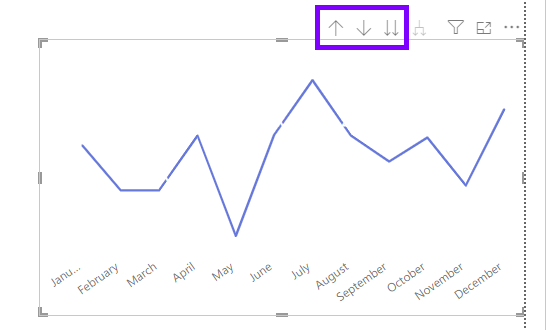
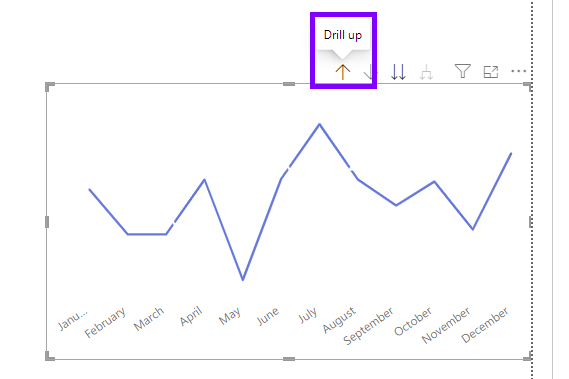
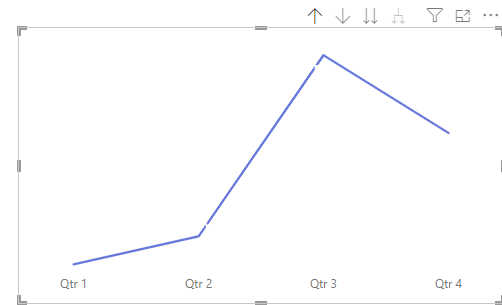
- Use Drill-Down: Users can click on the data point representing the higher-level category (e.g., a bar in the bar chart) to drill down and see the data broken down by the next level (e.g., quarters within a specific year).
Cross-Filtering
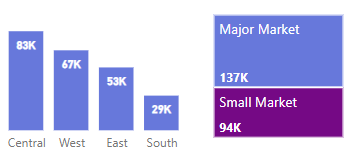
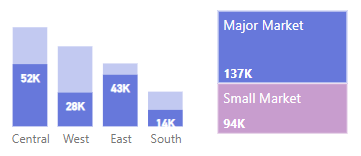
Cross-filtering in Power BI is an interactive feature that allows users to dynamically filter data across multiple visualizations on the same report page. When users select data in one visualization, it automatically filters the data displayed in other visuals based on the selected criteria. This feature enables users to interactively explore data relationships, correlations, and trends, leading to better insights and a deeper understanding of the data.
How Cross-Filtering works
- Place Multiple Visualizations on a Report Page: To enable cross-filtering, start by creating a report page and placing multiple visualizations on it. These visuals can be charts, tables, cards, or any other data representations.
- Interact with the Visuals: Now, interact with the visuals on the report page. When you click on a data point or select a filter in one visualization, Power BI will automatically apply the selected filter to other visuals on the same page.
- Check Cross-Filtering Compatibility: Not all visualizations in Power BI support cross-filtering. To ensure cross-filtering works as expected, make sure the visualizations are compatible and share common data fields. For example, if you have a bar chart and a table on the same page, both visuals should be based on the same dataset and share at least one common field to enable cross-filtering.
- Test and Fine-Tune: After setting up the visuals and interactions, thoroughly test cross-filtering in your report to verify that the results match your data analysis requirements. Fine-tune the visuals and filters as needed to provide a smooth and informative user experience.
With Drill-Through, Drill-Down, and Cross-Filtering features, you empower your report users to interact with data actively and explore insights in a more personalized manner. These interactive capabilities enhance the overall user experience and enable users to discover valuable information efficiently within Power BI reports.

