Tables in Excel provide a convenient way to organize, analyze, and format data. With tables, you can easily sort, filter, and apply formatting to your data. Here’s how you can create and format tables in Excel.
Table of Contents
ToggleCreate a Table
1. Select the data range that you want to convert into a table.
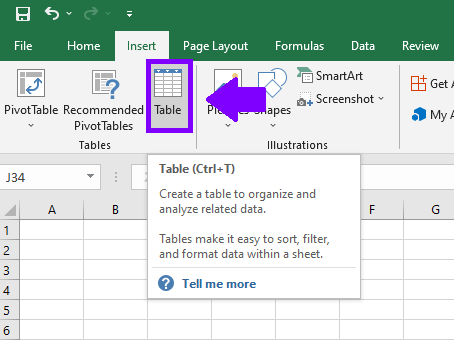
2. Go to the “Insert” tab in the Excel ribbon.
3. In the “Tables” group, click on the “Table” button.
Alternatively, you can use the shortcut key Ctrl+T.
Format a Table
1. With the table selected, the “Table Tools” tabs will appear in the Excel ribbon.
2. Use the “Table Design” tab to make overall changes to the table. Here are some options you can explore:
Table Styles: Choose from different predefined table styles to change the overall appearance of the table.
Table Name: Assign a unique name to your table, which can be useful for referencing the table in formulas or macros.
Total Row: Toggle the “Total Row” option to display a row at the bottom of the table for calculating totals or other summary functions.
Table Style Options: Customize various aspects of the table, such as header row formatting, banded rows, and the first column.
Tools: Remove duplicates from the table, insert slicers for filter options, or convert table back to range.
By creating and formatting tables in Excel, you can organize and present your data in a structured and visually appealing manner. Tables offer convenient features like filtering, sorting, and applying formulas that make data analysis more efficient. Experiment with different table styles and formatting options to create professional-looking tables that suit your specific needs.