PivotTables are powerful tools in Excel that allow you to summarize and analyze large amounts of data quickly and efficiently. They enable you to extract meaningful insights and visualize data in a concise and organized manner. Here’s a step-by-step guide on how to use PivotTables to summarize and analyze data:
Table of Contents
ToggleCreate Pivot Table
Prepare your data
To effectively use PivotTables, it’s important to ensure that your data is properly organized and formatted. Follow these guidelines to prepare your data for PivotTable analysis:
- Organize your data in a tabular format: Arrange your data in a table format with column headers. Each column should represent a specific data category or attribute, such as “Product,” “Region,” “Date,” or “Sales Amount.” Each row should contain a unique data entry or record.
- Include all relevant data: Make sure your data includes all the necessary information for analysis. Avoid leaving any blank rows or columns within the data range, as this can affect the accuracy of your PivotTable results.
- Use consistent data formats: Ensure that the data within each column is formatted consistently. For example, use the same date format throughout, such as “mm/dd/yyyy” or “yyyy-mm-dd.” Consistent data formats help Excel recognize and categorize your data correctly.
- Avoid merged cells: Do not merge cells within the data range. Merged cells can cause issues with PivotTable calculations and aggregations. Keep each cell in the table separate and distinct.
Select your data range
Highlight the entire range of data you want to include in your PivotTable. This can be done by clicking and dragging the cursor across the data range or using keyboard shortcuts.
If your data is well structured and organized, you can just click on any cell in your data table, and Excel will automatically highlight entire table.
Insert a PivotTable
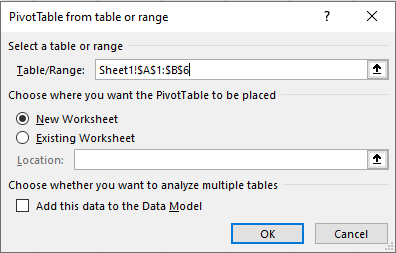
Go to the “Insert” tab in the Excel ribbon and click on the “PivotTable” button. A dialog box will appear, allowing you to specify the:
- data range and
- the location where you want to place the PivotTable (either a new worksheet or an existing one).
Handling Non-Numeric Values
You have a list of numbers in cells A1:A5, but some cells contain text values. To calculate the sum of the numbers while ignoring the text values, you can use the IFERROR function with the SUM function as follows:
=SUM(IFERROR(A1:A5, 0))
The IFERROR function replaces any non-numeric values with 0, allowing the SUM function to perform the calculation correctly without encountering an error.
Configure Pivot Table
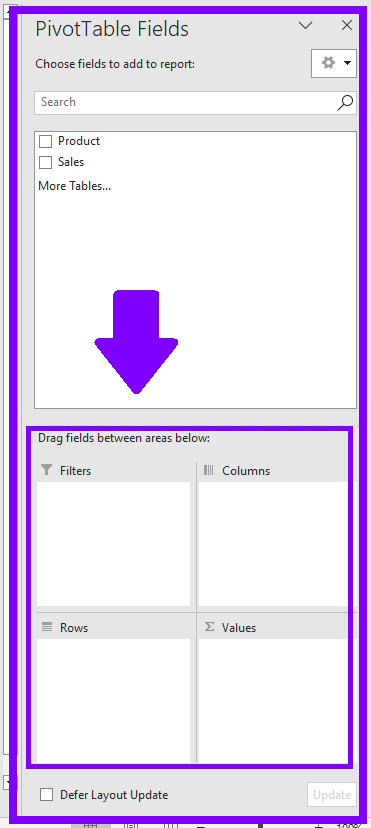
In the PivotTable Field List, you’ll see a list of all the column headers from your data range. Drag and drop the desired fields into the “Rows,” “Columns,” and “Values” areas, depending on how you want to summarize and analyze your data.
- Rows: This area defines the rows of your PivotTable and represents the categories by which you want to group or segment your data.
- Columns: This area allows you to create additional levels of grouping or segmentation by adding column headers to your PivotTable.
- Values: This area determines the values you want to summarize or analyze. You can perform functions like sum, count, average, etc., on numeric data.

You can further customize your PivotTable by applying filters, sorting data, and formatting the appearance of your table. Excel provides various options and tools to help you refine and enhance your PivotTable’s presentation and analysis.
Update Pivot Table
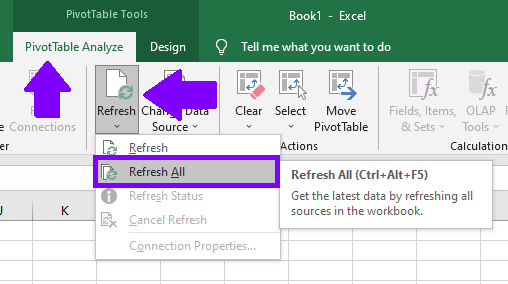
If your source data changes or updates, you need to refresh your PivotTable to reflect those changes. Right-click anywhere in your PivotTable and choose “Refresh” to update the data.
If you have multiple Pivot Tables, you can refresh them all at once. Go to “PivotTable Tools” tab, and within “PivotTable Analyze” select Refresh > Refresh All.
PivotTables allow you to slice and dice your data, explore different perspectives, and summarize information in a dynamic and interactive way. They are particularly useful for analyzing large datasets, identifying trends, comparing data, and generating insightful reports.
By mastering PivotTables, you can leverage Excel’s analytical capabilities and make informed decisions based on a clear understanding of your data.