Excel tables offer various customization options to enhance the visual appearance and functionality of your data. You can apply table styles to make your table visually appealing and easily distinguishable. Additionally, you can add a total row to calculate summary statistics or perform other calculations.
Table of Contents
ToggleApplying Table Styles
1.Select any cell within the table.
2. Within “Table Design” ribbon, locate “Table Styles” group.
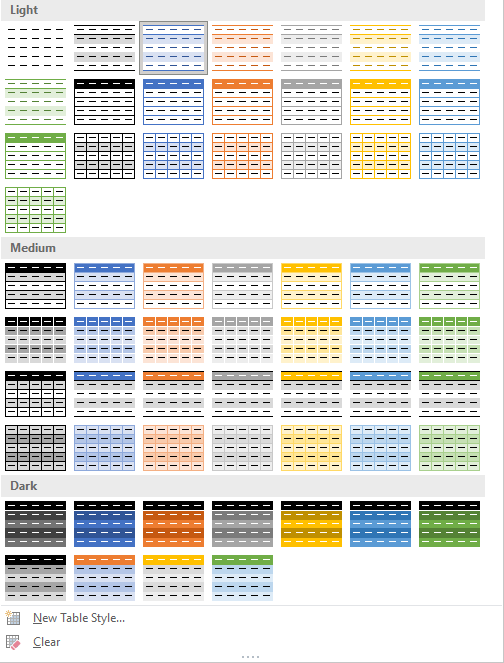
3. Hover over different table styles to see a live preview of how they will look on your table. Click on the desired table style to apply it to your table.

4. “New Table Style” button allows you to create custom table style from scratch.
You can also customize the table style further by using the “Table Style Options” checkbox. This allows you to control specific elements like header row formatting, banded rows, and the first column style
Adding a Total Row
1. Go to the “Table Design” tab and locate the “Total Row” checkbox in the “Table Style Options” group.
2. Check the “Total Row” checkbox. Excel will add a new row at the bottom of the table with the same formatting as the header row.
By default, the total row will display the “Sum” function for each numeric column in the table. However, you can customize the calculations in the total row to perform different functions. Excel provides various summary functions such as Sum, Average, Count, Max, Min, and more.
3. If you want to perform a custom calculation in the total row, enter the formula directly into the cell.
4. Excel will automatically update the calculations in the total row as you modify the data in the table.
By applying table styles, you can make your data more visually appealing and easier to interpret. Adding a total row allows you to calculate summary statistics or perform custom calculations directly within the table.

